We need to plot the perimeter points of a circle whose center co-ordinates and radius are given using the Mid-Point Circle Drawing Algorithm.
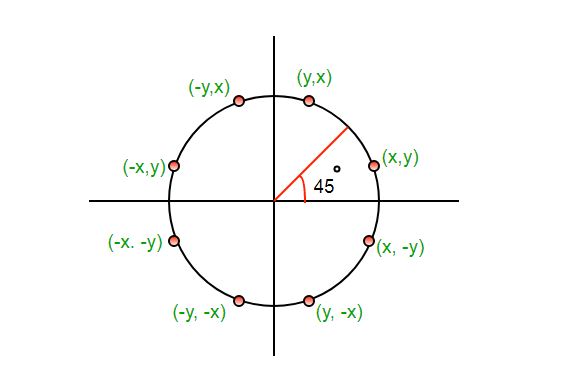
We use the above algorithm to calculate all the perimeter points of the circle in the first octant and then print them along with their mirror points in the other octants. This will work only because a circle is symmetric about it’s centre.
The algorithm is very similar to the Mid-Point Line Generation Algorithm. Here, only the boundary condition is different.
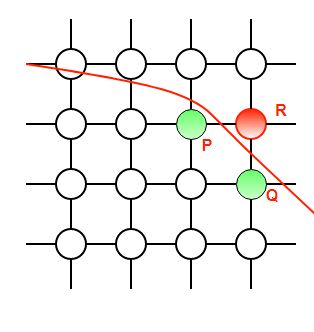
For any given pixel (x, y), the next pixel to be plotted is either (x, y+1) or (x-1, y+1). This can be decided by following the steps below.
- Find the mid-point p of the two possible pixels i.e (x-0.5, y+1)
- If p lies inside or on the circle perimeter, we plot the pixel (x, y+1), otherwise if it’s outside we plot the pixel (x-1, y+1)
Boundary Condition : Whether the mid-point lies inside or outside the circle can be decided by using the formula:-
Given a circle centered at (0,0) and radius r and a point p(x,y)
F(p) = x2 + y2 – r2if F(p)<0, the point is inside the circle
F(p)=0, the point is on the perimeter
F(p)>0, the point is outside the circle
In our program we denote F(p) with P. The value of P is calculated at the mid-point of the two contending pixels i.e. (x-0.5, y+1). Each pixel is described with a subscript k.
Pk = (Xk — 0.5)2 + (yk + 1)2 – r2
Now,
xk+1 = xk or xk-1 , yk+1= yk +1∴ Pk+1 = (xk+1 – 0.5)2 + (yk+1 +1)2 – r2
= (xk+1 – 0.5)2 + [(yk +1) + 1]2 – r2
= (xk+1 – 0.5)2 + (yk +1)2 + 2(yk + 1) + 1 – r2
= (xk+1 – 0.5)2 + [ – (xk – 0.5)2 +(xk – 0.5)2 ] + (yk + 1)2 – r2 + (yk + 1) + 1
= Pk + (xk+1 – 0.5)2 – (xk – 0.5)2 + 2(yk + 1) + 1
= Pk + (x2k+1 – x2k)2 + (xk+1 – xk)2 + 2(yk + 1) + 1
= Pk + 2(yk +1) + 1, when Pk <=0 i.e the midpoint is inside the circle
(xk+1 = xk)
Pk + 2(yk +1) – 2(xk – 1) + 1, when Pk>0 I.e the mid point is outside the circle(xk+1 = xk-1)
The first point to be plotted is (r, 0) on the x-axis. The initial value of P is calculated as follows:-
P1 = (r – 0.5)2 + (0+1)2 – r2
= 1.25 – r
= 1 -r (When rounded off)
Examples:
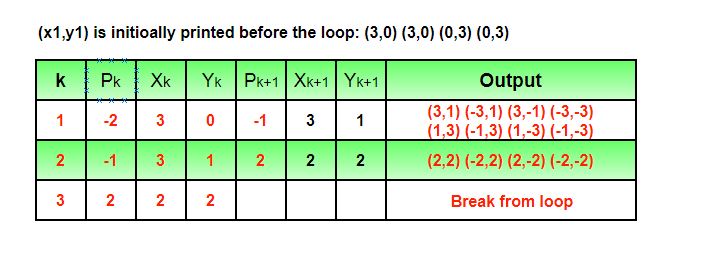
Input : Centre -> (0, 0), Radius -> 3
Output : (3, 0) (3, 0) (0, 3) (0, 3)
         (3, 1) (-3, 1) (3, -1) (-3, -1)
         (1, 3) (-1, 3) (1, -3) (-1, -3)
         (2, 2) (-2, 2) (2, -2) (-2, -2)
Input : Centre -> (4, 4), Radius -> 2
Output : (6, 4) (6, 4) (4, 6) (4, 6)
         (6, 5) (2, 5) (6, 3) (2, 3)
         (5, 6) (3, 6) (5, 2) (3, 2)